5 Data Analytics Tools Your Business Can’t Live Without
“Data helps you run the business world, but very often, they are unclear, unstructured, and semi-structured. You need to dig in harder to discover the patterns that matter – but what keeps you easygoing is data analytics tools that push itself to the threshold for in-depth analysis.”
Introduction
Data analytics indeed creates lots of ample opportunities to get into the root level of every problem. But again, it makes a bunch of loopholes, too, that tools only can fill as time is less and demands accuracy to enhance the risk-taking abilities.
In the world of businesses, the application of the tools doesn’t limit to the market’s demand. Still, it extends in broad ranges, from flattering the end-products to understanding the targeted audience and their pain points, serving them in dynamic ways to keep customers happy all time. That’s the prime role for analytics tools – it’s converging to one point – intelligent decision making.
In this blog, you learn the details about data analytics, their importance in businesses, the use of tools in data analytics, tips for choosing the right tools for your business, and five data analytics tools your business can’t live without.
Let’s dive in for more details, and here we go.
Data Analytics: What is it? Why is it So Demanded?
 Data analytics means analyzing raw data to reveal its hidden patterns and forming conclusions from that information, then utilizing them to facilitate goals and objectives that every business carries.
Companies use data analytics to improve their performance, implementing them in the business models to reduce costs and find efficient ways of doing business based on the trending data. With data analytics, taking calculated risks and making the intelligent decision to analyze customers leads to better products and services.
Data analytics itself is a broad topic that incorporates diverse types of data analysis subject to improving things, from revealing trends and metrics to understanding them closely; data analytics has heavy-weighted applications looking into the business world.
Why Do You Need Tools For Data Analytics?
 Companies struggle to find the correct data to follow the newest trend in the market, reduce their investments efficiently, and optimize their performance. At the same time, they maximize profits by taking calculated risks.
The analysis is often riskier for two reasons: either data available is irrelevant, or the team is not efficient enough to hit the right target, leading to many blunders. Only 20% of the professionals are efficient in decision making according to Mckinsey and company reports.
It proves a simple thing, i.e., the process is quite laborious and time-consuming. When you do analysis manually, the efficiency is low. Therefore, many techniques and strategies are automated to save time, boost efficiency and add credibility to the data infusing intelligent algorithms powered by AI and machine learning that works on raw data without human interference.
5 Tips For Choosing Your Data Analytics Tools In 2021
 It’s 2021, and half of the years have already passed in the eyes. Now don’t say you never use any advanced tools for your business. Or if you started using some of the tools:
Here are a few questions to test your tools’ efficiency:
- Did you have a hard time choosing the right and efficient tools?
- And are your tools working efficiently to what you bought them for?
- Did you explore all the features your tools are having?
If most of your answer is no, then you have not got the right tools for your business. Here are five valid points to help you get the best data analytics tools for your business. And trust me, they will work like wonders.
Research And Discover Why You Need Tools?
Determine the current state of analytical tools implementation, like what features you want in tools and how that will benefit your business. Do in-depth analysis with critical stakeholders, intelligence developers, administrations, and other personnel. That helps your team understand the ins and outs of the problem you have and how tools can help.
Look For The Current State In The Market.
Do your bit of research before picking a particular tool. Look for its updates and new features released recently other than going blindfolded. Many ads are running for tools. If you don’t research, there are maximum chances you may fall into the trap that is placed at a lower price but not practical or revamp versions of outdated tools.
Tools Capability and Classification
Classify the list of tools based on their uses, capability of solving your problems, features, price, popularity. And how often they release the new features. Look for enough tutorials on how to use those tools and blog updates on their website.
By doing this, you will get to know inside out about many tools suitable for your business.
Use Decision Matrix For Better Decision Making
Make sure you know what these tools can do for you, how their interfaces work, and how robust the tools when compared to the price they charge. Data analytics tools are indeed best for creating advanced algorithms but may be lacking additional other features.
Use a decision matrix to clear the air and go for the right ones.
Get Your List Of Tools Ready!
Once you finalized the above four steps, you already got the list of tools you buy next. But this is not the end; everything starts from there. If available, use their trial versions to know most about them and decide your next step. After using the free and premium features, go for the best ones considering your budget. That’s all.
5 Data Analytics Tools Your Business Can’t Live Without in 2021
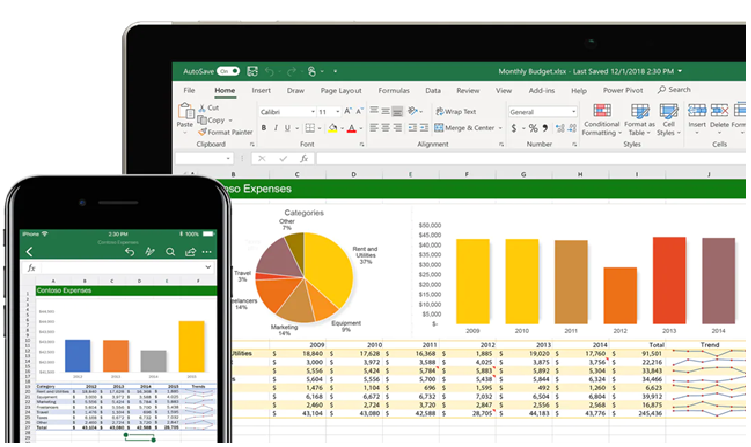
Microsoft Excel
 The two most powerful tools that Microsoft has ever released in the market are Windows OS and Microsoft Office Suite. From drafting in the document to tracking the records on Excel Sheets and sending to prospects from Outlook has become a new routine these days.
But what makes Excel stand out from the list is some powerful features that make data analysis hassle-free with form creation, pivot table, VBA, etc. Excel has the best statistical features that no one can transcend when it comes to formula-based solving. The platform is robust and straightforward, user-friendly navigation.
And suppose you become thorough with Microsoft Excel. In that case, you can outperform many big players in the market. The results are accurate and come with in-built data visualization techniques that are always the first-choice tool for data analysis.
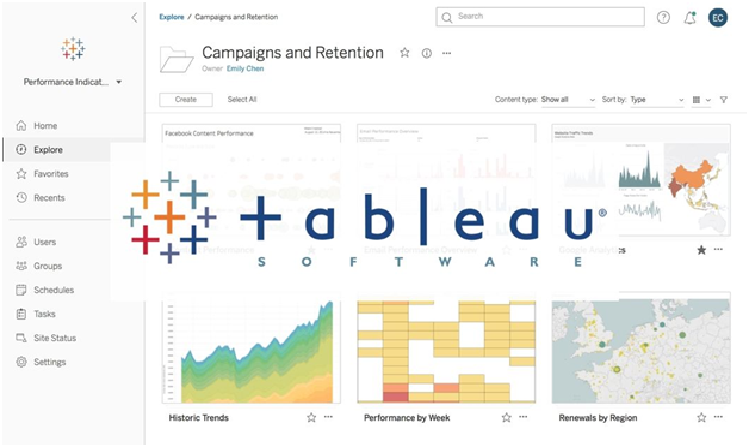
Tableau for Data Visualization
 If you have got to pick the only tool for data visualization, then it has to be Tableau undoubtedly, as their motto is quite simple and yet quirky. It says find easy answers to the most challenging questions with one of the leading analytical platforms in the world.
Tableau is a visual analytics platform created to transform how people use data to solve a particular problem. The interface is easy to use, has the best community support in the industry united by data. The platform allows you to integrate Salesforce, CRM, and other functionalities to boost your analytics results and build a data culture that holds experts’ trust. It’s a freemium tool that comes with a free trial.
R, Python, and JuPyter Notebook
 Though Python is the most popular machine learning language, R languages are not too far behind when compared between duos. Even the cluster analysis and spiline are superior in R compared to Python during the latest analysis as of 2019.
Though Python works perfectly on JuPyter, there is something that makes the JuPyter Notebook even more popular. Can you guess that! Although you can run R programming on JuPyter, it can take a long time and waste a lot of time if your concepts are unclear.
If you breakdown the whole process, it will become a series of processes; you have to call:
- Importing R (base) function
- Importing R libraries
- Populating vectors and data frames and formulas that R understands
- Running models in R and getting the result back on Python
- Getting model prediction and plotting in R
Xplenty
 Xplenty is the next-level tool based on AI and ML advanced algorithms that integrate, process, and prepare data for analytics on the cloud platforms. It comes with a graphical interface to implement ETL, ELT, and counter solutions.
This platform helps you create complete data pipelines with less coding or zero coding capabilities with solutions for marketers, developers, sales, and support. They even extend great support through email, phone, chat, and video calls.
It is a flexible and scalable cloud platform that connects multiple data sources with out-of-the-box data transformation components. It has extensions for you to communicate with complex datasets and offers API components for advanced customization to fit your needs.
Qubole
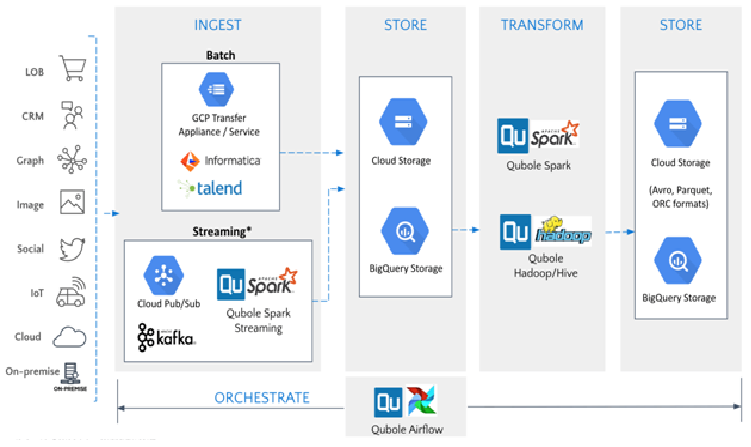
Qubole performs the best for Big data platforms that manage, learn and optimize data independently. The prime objective is to let the employees concentrate on business outcomes instead of executing the Qubole.
The Qubole platform is super-fast, flexible, and scalable. And the prime role is to optimize spending and boost the use of big data analytics. The application platform is transmissible and made up of good navigation dashboards that eliminate poor performance and lock-in facilities and are available globally for all AWS regions worldwide. A few giant corporations that rely on Qubole are Warner music group, Adobe, and Garnett.
Final Words
Without the right choice of tools, data analytics is a long-term game that lacks accuracy and puts the business at higher risk. That’s one of the top reasons enterprises face hindrance and even breakdown in their peak time for simple unnoticed data errors.
Therefore, data analytics is crucial to making any decision-taking calculated risk. This blog tells about five data analytics tools you must use for your business and be ahead in the competition.