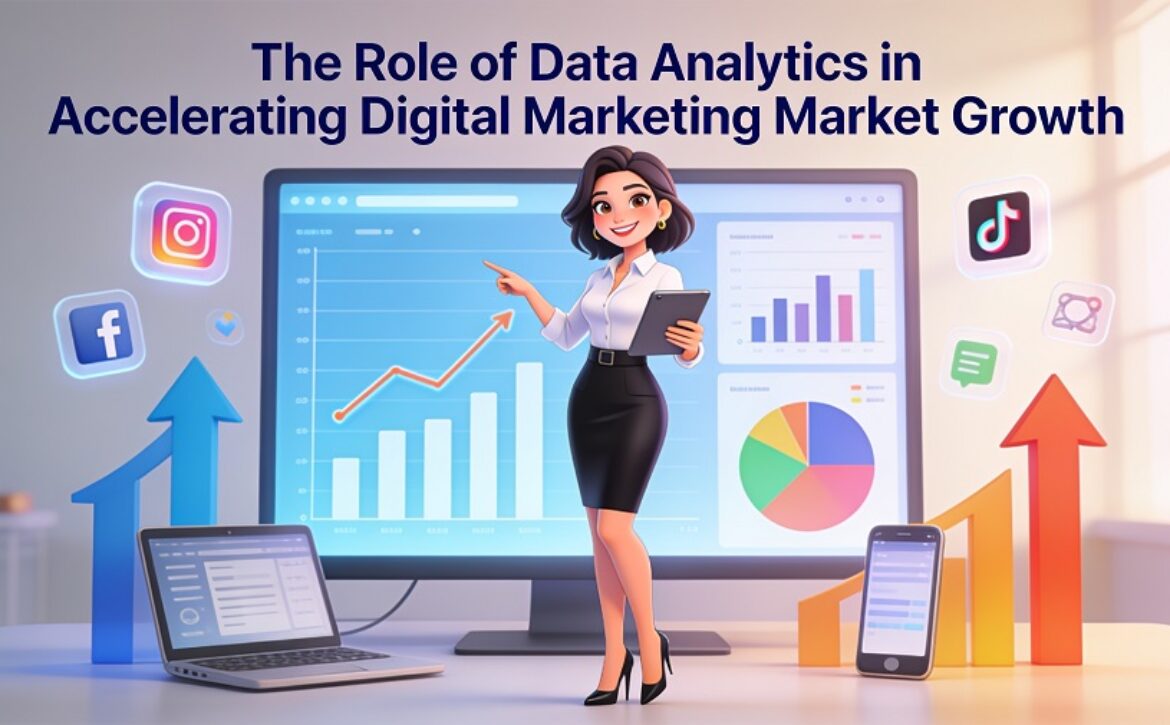
The Role of Data Analytics in Accelerating Digital Marketing Market Growth

Technology is changing the way businesses communicate with customers on a day-to-day basis, how businesses measure performance, and how they make their long-term plans. In the past two years alone, billions of pieces of data have been collected by businesses through the countless contacts that they have with their own customers through websites, apps, social media, search engines, and Internet retail operations. Because of all of this data being produced at such a rapid rate and accumulating over a longer period of time, the direction of analytics has shifted from being primarily used to support other functions to being an area of primary focus in moving forward with decision-making through the use of data in all industries.

To gain perspective on the continuous evolution of the Global Market Place of Digital Marketing [Mercado Mundial De Marketing Digital] from this point forward, one must also recognise that the role of analytics will continue to grow and play an increasingly important part in how businesses develop their digital strategies and create connections with their customers. Access to more and more detailed information on individual audience behaviour, as well as recognising changes in different market segments, will allow companies to make a much more informed decision and create an overall enhanced digital presence, while adapting to the constantly evolving demands created by consumers due to ever-changing trends. Increasingly, analytics is becoming one of several forms of the core components that are helping boost the Global Digital Marketing Marketplace.


Understanding Data Analytics in the Digital Environment

——————————

The term “data analytics” includes gathering, organising, analysing and interpreting large amounts of data gathered from numerous different sources like websites, mobile apps, social media, online purchases, customer feedback, and search activity to find patterns and insight.

The goal of data analytics is not just to collect data, but also to turn raw data into intelligence, or insight that can help an organisation make better decisions. Organisations use analytical tools and methods to help them understand how people behave, find common threads, measure how well something worked, and increase the efficiency with which they operate.

As the digital world becomes more complex, being able to analyse large volumes of information is essential for understanding how people use digital channels and services.


The Growing Importance of Data in Digital Ecosystems

——————————

An unprecedented amount of data is being generated by the digital economy. Every online interaction creates more behavioural, transactional, and engagement data, which in turn helps to build an understanding of how consumers behave in the digital world (i.e., what they look at when they are browsing through different websites or apps and how they are influenced by these experiences – and so on).

The growing availability of data has changed the way organisations plan and evaluate their operations. Rather than just depending on history and experience, decision-makers are now able to use evidence-based insights to understand current conditions and predict future events.

The shift to data-driven decision-making has improved transparency and increased accountability while also enhancing the ability (or components) to measure results across all digital activities.


Analytics Help You Understand Your Audience

Data analytics is helping us to gain more knowledge on how our target audience acts and behaves online. By generating and collecting information from a variety of places (such as social media networks, websites, etc.), it’s possible for organisations to systematically analyse and extract data from different sources, allowing them to find patterns of how users interact with their products, content and services.

Data from analytics can tell you what content users enjoy the most, how long users stay engaged with that content, what device they used, and where in the user journey they are blocked. Being able to do this enables organisations to have a richer understanding of the preferences and behaviours of their target audience.

As consumers continue to change, being able to analyse data will become more important than ever. Analytics provide organisations with the tools to adjust to changes in their audience and deliver theh the right digital experiences.


Utilising Evidence to Improve Decision Making Within an Organisation

The use of data analytics is a key component for an organisation to enhance its ability to effectively make decisions. Traditionally, organisations used a significant amount of intuition, assumption and/or very narrowly defined data to make their decisions. While such experience will always be important, we live in a digital age that requires greater levels of precision, objectivity and measurable processes for those organisations.

When organisations utilise data sources and data analysis, they can better assess their level of performance compared to their original objectives and identify opportunities to improve performance within their organisation. In addition, decision makers can compare results across multiple dimensions, look for trends and identify which actions contribute most to achieving their overall objective.

An organisation can reduce its level of uncertainty and be able to make more informed decisions when using a data-driven approach. Additionally, based on the improved understanding of its organisation via data analysis, the allocation of resources can be done more effectively. Organisations will also be able to modify their strategic priorities as conditions change based on data and analysis.


The Role of Real-Time Data Analysis

——————————

In recent times, there has been a lot of progress in real-time analytics. With all of the advancements made in both computing power and cloud-based technology, organisations can now process and analyse information virtually instantaneously.

Real-time analytics allow for much quicker responses to changes in circumstances, as organisations are able to monitor events as they happen and change their actions if needed without having to wait weeks or days for reports. With the rapid pace of change taking place within the digital environment, this rapid response time is very helpful to organisations in understanding changing consumer behaviour.

Organisations have immediate access to information that will help them identify emerging trends, identify problems sooner, and better meet the needs of users. When organisations use real-time data instead of historical data, they can improve their performance and adaptability in ways they could not without real-time data.


Planning for the Future with Predictive Analytics

Traditional analytics are used to understand present and past events. Predictive Analytics uses data analysis to predict what might happen in the future based on patterns in historical data. Predictive models allow us to estimate how people will act in the future and identify possible future trends.

Predictive analytics is increasingly important as businesses face more complex, rapidly changing digital environments. Predictive analytics helps decision makers to evaluate potential opportunities and risks before they emerge.

Although predictive analytics does not guarantee anything, the insights gained from predictive analytics give businesses valuable information to help them with planning and managing risk. If we can be more proactive in our responses to change, we will be able to improve our level of preparedness and make better strategic decisions within our environment.


Artificial Intelligence and Advanced Analytics

The use of artificial intelligence has greatly increased the ability of data analytics to function as an analytical tool. This ability is due in part to machine learning algorithms able to run through large amounts of data and identify patterns and gain insights from that data at a pace and volume that a human analyst would find overwhelming to do alone.

AI is also used to support many different types of analytical processes, such as pattern identification, trend identification, forecasting and detection of anomalies and so on. These types of analytic processes are used to gain more insight into extremely complex datasets in order to provide organisations with greater value.

Artificial intelligence technology continues to evolve, and with this, the use of artificial intelligence within analytics will continue to grow. The continued evolution of advanced analytics systems will increase the opportunity for organisations that could use this type of technology to receive the benefits of advanced analytical processes.


Using Insights from Data for Personalisation

Data analytics can easily be seen in how digital media is personalised. Digital platforms now collect behavioural information on users to personalise the type of content, recommendations, and overall user experience.

The process of personalising an experience relies upon analysing user behaviour to determine interests, behaviours, and any patterns they might have. By determining these things, we can provide experiences that are as meaningful and interesting to the individual as possible.

The increased demand for personalised digital experiences has created a growing need for analytics. Companies that can analyse data to understand users will be able to provide more engagement and allow for greater interactions within the digital realm.


Improving Performance Measurement

Using analytics lets businesses accurately track how well they are meeting their goals. Most digital solutions track user engagement, conversion rates, site visits, content consumption, and customer journey.

Businesses can now objectively evaluate the results and determine what factors are impacting performance. With detailed metrics for basic measurements and their impact, rather than building broad assumptions about performance, business leaders will be able to measure more specifically.

Real-time measurement enables companies to continuously improve by allowing them to identify strengths or weaknesses in their processes and plan for future improvements. As more and more business competition moves to digital platforms, the ability to measure performance accurately will become increasingly critical.


Analytics and the Customer Experience

The customer experience has emerged as a core focus within many of today’s digital industries. Analytics helps organisations to understand how their customers behave when using digital platforms and how to make improvements to said platforms.

Through analysis of behavioural data, organisations are able to uncover friction points and usability problems, as well as identify barriers to a positive user experience. Insights gained from this analysis provide critical input to improve a provider’s website design, navigation, content structure and overall customer experience.

The better organisations are able to understand how their customers experience digital environments, the better the organisation can create more intuitive and accessible environments for their customers, which ultimately leads to higher levels of engagement and customer satisfaction.


Challenges Associated with Data Analytics

Data analytics presents a significant challenge, even with its numerous advantages. One big issue surrounding data analytics is related to privacy and data security. The amount of information collected by businesses is growing at a fast pace, so it has become extremely important to ensure that the data collected is handled responsibly.

Since regulations surrounding privacy and protection of personal data keep changing, it is critical that businesses can continue to balance their desire for deeper insights into their customers with their obligation to protect those customers’ personal information and maintain their customers’ trust.

Another potential difficulty for businesses is the accuracy of their data. The quality of data used to conduct an analysis greatly impacts the quality of the analysis produced. Therefore, finding inaccurate or inconsistent data can negatively impact the analyses created from it.

Many businesses also have difficulty finding professionals with the skills necessary to maintain complex analytical applications. Therefore, it is very critical for the majority of industries to continue working to create the skill sets in Data Science, Analytics, and Artificial Intelligence necessary to be successful.


Emerging Trends Shaping the Future of Analytics

The concept of data analytics will be shaped by a number of emerging trends. Artificial intelligence advancements will allow for continued automation and improved accuracy of analyses, enabling organisations to take advantage of increasingly complex datasets.

The emergence of cloud-based solutions will allow for increased scalability and access to resources, thus helping organisations analyse their data more efficiently. Improvements in visualisation tools will also make information easier to read and communicate.

Additionally, privacy-enhancing technologies are becoming increasingly prevalent. With the arrival of new laws and growing public perception of these technologies, many organisations are looking for new ways to manage both the analytical capabilities of their data and the protection of privacy.

Overall, analytics is likely to remain a key component of the ongoing digital transformation that will occur throughout many sectors and areas of business.


Future Outlook

Data analytics is projected to grow in significance as digital ecosystems grow increasingly complicated,d with many connections between them. Organisations will keep depending on data-driven insights to comprehend their target audiences, assess the success of their current ventures, and adjust response strategies based on changes in the marketplace.

Increased capabilities for data analytics will be obtained through advances in artificial intelligence, machine learning, and cloud technology. These advancements will provide quicker, more precise processes for making well-informed decisions. The amount of available data is going to continue to expand, nd which will open up various opportunities for innovation as well as put pressure on organisations to have sound governance and ethical practices relating to data use.

As the digital environment continues to advance, organisations that successfully extract and leverage data insights will hold the best positions to successfully adapt to changes and deal with growing complexities in the modern marketplace.


Conclusion

Digital data analytics continues to be a significant contributor to the growth of the global economy. It is possible to use analytics to analyse significant amounts of data to gain valuable insights that can assist businesses in analysing their audiences, making better decisions, enhancing customer service, and measuring performance.

With the continued development of digital technology creating ever-greater amounts of data, the use of analytical capabilities will become increasingly critical. While challenges related to privacy, data quality, and skills development are still present today, the continual advancement of artificial intelligence and cloud computing has opened up the possibilities for modern analytical techniques.

As digital ecosystems continue to become increasingly data-focused, the use of analytics will be a critical component of making informed decisions in the long-term development of digital technologies. The ability of analytics to help businesses identify patterns and opportunities and then justify their strategic decisions will have a considerable impact on the future of digital transformation in the world.

Read More
Sanju June 29, 2026 0 Comments

Latest BI Software Updates Changing Data Analytics in 2025

Introduction

In the rapidly changing BI landscape, data is more than you think. Data analytics becomes crucial, since it brings innovation & competitive benefits across industries. From e-commerce giants to medical care services, businesses use big data analytics to make valuable decisions. Data is playing a crucial role in making data-driven decisions & growth.  Among several software, Power BI attracts all eyes.

Whether you have a small business or a large enterprise, utilize the benefits of BI tools & see how they are reshaping data analytics in 2025. In the future, the data warehousing company will continue to transform the way organizations think about. Power BI is leading the way to make data easy & accessible. This time, advanced BI software comes with the new features, enhanced design & emerging tech.


1. The State of BI in 2025

———————————–

1.1. Growing Demand for Real-Time Insights

Due to the high popularity of the BI platform, the market has an array of options. Microsoft Power BI is leading the edge, thanks to the data visualization functionalities. It contains a streamlined interface that can be accessed by a non-tech team partner. It has the benefit of sharing real-time data streaming facilities, enabling organizations to connect seamlessly with IoT devices.  The power of business intelligence and data warehousing trends 2025 allows organizations to collect the performance of team members, measure events in real-time, so that decisions can be made based on the latest data.

There are various industries that rely on real-time data. Some common industries include healthcare, finance & logistics, etc. Moreover, real-time monitoring and live tracking facilities help industries to take necessary approaches. Organizations should adopt agile techniques & encourage operational efficiency to match the challenges & resolve them for better performance. Go through the following statistics & understand the ongoing demand for BI software in data analytics-

  • Based on the statistics, the worldwide data analytics landscape is expected to reach $132.9 billion by 2026, with a CAGR of 30.08%.
  • Integrating data analytics in an organization can enhance growth & drive profits by 50%.
  • Business utilizes data-driven decision-making to improve operational productivity by 63%.
  • 80% of organizations are incorporating data analytics to accelerate business innovation.
  • Over 90% of businesses achieved measurable value from data analytics.


1.2. BI and AI Convergence

AI is introducing a new era of business intelligence and data warehousing, basically transforming the way businesses extract value from their data. By integrating advanced analytics, AI accelerates the BI tools’ potential. Integration of AI makes data informative and insightful. Here, check how AI reshapes the BI software landscape-

  • Traditional BI involves manual data preparation, consumes valuable resources, and time. AI automates data cleansing, integration & transformations, allowing the team to prepare the data faster & accurately. AI optimizes search experience & drives the data modeling efficiency.
  • Historical data analysis offers insight into the past, but they don’t have the potential to predict future trends. ML algorithms in a BI tool can measure historical data to make predictions. It helps to calculate the market trends, challenges & customer behavior.
  • AI-powered BI software delivers personalized insights designed for individual user preferences. By measuring the user behavior & historical interactions, AI can recommend the reports & highlight the key metrics. The personalization drives the user experience & verifies that you receive the relevant information.
  • Embedding AI-powered BI and data warehousing tools ensures seamless integration, improves user adoption rate & boosts productivity. The innovative AI-driven search approaches can streamline the process, accelerate user-friendliness, and improve efficiency.

Overall integration of AI into BI tools ultimately contributes to making better decisions for every organization.


2. Major BI Platforms and Their 2025 Updates

———————————–

2.1. Microsoft Power BI

Microsoft Power Business Intelligence data warehousing is a data analysis tool offering drag-and-drop features for extracting insights. It integrates with multiple Microsoft products & offers AI features to assist with designing dashboards. Users can design data, define relationships & craft documentation to enhance the data analysis & exploration. Keep your attention to the following features:

  • Power BI enables users to visualize the data in real-time with interactive graphs & charts.
  • Users can filter information to search insights & understand relationships.
  • Users can compare the data across various time periods to track trends & anomalies.
  • Data modeling assists in defining the relationship between the data sources for deep data analysis.
  • Power BI seamlessly combines various information sources, involves databases, cloud services & streamlines the data consolidation. It ensures analytics are based on the current data.
Pros
  • Power BI, business intelligence data warehousing, integrates smoothly with Microsoft services such as Excel & Azure, making it an ideal option for businesses.
  • It has features like Microsoft Copilot that automate insights & generate reports, and drive the user experience.
Cons
  • The licensing structure can be confusing, leading to unexpected costs.
  • Basic features are user-friendly, but to access advanced tools, you need a strong learning curve.


2.2. Tableau (Salesforce)

Tableau is an advanced data analytics and Business Intelligence data warehousing tool that aims to deliver interactive data visualization. The tool was developed in 2003 by Salesforce with the goal of assisting organizations in turning raw data into visuals. It helps with decision-making, and that’s why it is widely used by data analysts. It has the potential to manage complex data and design a dashboard with minimal technical knowledge. The wide range of data integration options makes this a suitable option for all business sizes.

  • Users can design the dashboards that allow filtering, in-depth research, and visuals for tracking key metrics.
  • Tableau connects to multiple data sources, including Excel, SQL database, cloud platforms & APIs.
  • It allows a comprehensive view of data, making it an easier option to organize raw data into a suitable, organized format.
Pros
  • An interactive dashboard for the data analysis
  • Customized visualizations to match various needs
  • It has the ability to integrate with multiple data sources.
Limitations
  • Advanced features are complex for new users to navigate.
  • It may show performance loopholes in large datasets.


2.3. Qlik Sense

This is the data-visualization solution released in 2014. It has the potential to perform data integration to visualization. Qlik Sense makes the understanding of data & task processing less complicated. The interface of the tools is user-friendly with a drag & drop function. The tool enables the design of an interactive dashboard that further makes the storytelling interesting. Explore some crucial features of this tool-

  • It facilitates data analysis by allowing data integration from various sources, whether databases, operational systems & data sheets.
  • A responsive design allows users to operate this on any device.
  • The presentations are interconnected to present decision-makers with quality diagrams precisely.
Pros
  • Drag & drop visualizations.
  • A comprehensive data storytelling
  • Access to analyze, anytime & anywhere.
  • Personalized reports & dynamic dashboards
Cons
  • Slow performance during data synchronization
  • High loading time


2.4. Looker (Google Cloud)

Looker BI and data warehousing are the cutting-edge BI tools designed by Google Cloud. This tool helps organizations to unlock actionable insights from data. In 2025, data will become frequently central to strategic decision-making. Looker software stands out as a modern, cloud-native architecture. The tool has scalable & advanced analytics capabilities. Here, check the advanced features-

  • Looker BI tool empowers organizations to track, visualize & operationalize data in real-time. The team can describe the seamless data metrics & logic over the organization.
  • It ensures reliability, accuracy & transparency. Unlike traditional BI software, this advanced BI software integrates seamlessly with Cloud data warehouses.
  • It allows faster queries, enhanced performance & minimal data duplication.
Pros
  • The basic version is free, but it offers a range of benefits.
  • An intuitive dashboard & report creation
  • Convenient templates improve team productivity.
  • A versatile & customizable solution
  • Ease integration with the Google platforms.
Cons:
  • Lack of transparent pricing.
  • Limited customer support
  • Lagging errors·


3. Key Trends Driven by BI Software Updates

———————————–

3.1. AI-Augmented Analytics

As per the recent study by McKinsey, the next-gen AI-powered analytics are witnessing a 20% increase in profit. As per the market prediction, by 2026, GenAI will significantly change 70% of design & development effort for the new web app.  The concepts of AI and ML are used in augmented analytics, a form of data analysis, to help automate tasks ranging from data preparation to insight production. Without requiring extensive technical knowledge, it can clean and merge datasets. It is responsible for spotting trends, recommending actions, and even visualizing results.

The fact that augmented analytics is intended for non-technical users sets it apart from typical business intelligence. Business users can examine data independently, pose follow-up queries, and make choices more quickly rather than waiting for a data team to create a dashboard. It is a major force behind self-service analytics, which makes it easier for teams to move from data to action. The AI-augmented trend is evolving fast with the innovations, making analytics more accessible & actionable. Augmented analytics isn’t limited to a single industry. This trend is being utilized across various sectors to assist teams in making faster & better decisions.


3.2. Self-Service Analytics at Scale

Extreme reliance on business analytics and technical personnel can be a loophole in the BI process, slowing down the process of decision-making. This is why self-service BI is getting popular. The worldwide BI market is projected to grow $5.71 to $20.22 billion by 2030. The self–service BI tool allows every business user across various functions and skill levels.

Each can access and analyze the insights from business data. Self-service BI offers a user-friendly interface that enables users to navigate the business data seamlessly. It also allows data visualization through an engaging drag-and-drop interface. It allows authorized stakeholders to design valuable insights.


3.3. Embedded BI in Everyday Tools

The embedded BI component is the fastest trending BI trend. The market of embedded BI, worth $68.88 billion in 2024, is expected to reach $132.03 billion by the next 4 years. With embedded analytics, BI elements are incorporated into the apps & workplace landscapes. It brings BI to the existing workflows, rather than designing new workflows rather than designing new workflows.

The learning curve is lowered, comprehension and performance are improved, and the time it takes to realize value is shortened when BI insights can be produced from well-known applications. All stakeholders can benefit from BI when analytics are integrated into key business applications, which also facilitates data-driven conversations and the easy exchange of insights.


3.4. Data Governance & Trust Layer Enhancements

To deliver the actionable insights, BI and data warehousing software must process a wide volume of business data. BI has become more democratized through self-services in recent years, which drives the risks. Since BI software is activated across multiple cloud domains, the risk of unauthorized access & lack of trust in data increases.  Maintaining the quality, security & integrity of data is central to the BI strategies.

Data governance includes defining clear data ownership & usage policies. It involves the implementation of encryption and role-based access control. Data governance extends to balance the oversight and control for AI’s use. It is necessary to leverage AI to understand predictive analytics & dynamically refresh the organizational context. Recent market reports analyzed that the market will grow from $3.27 billion to $8.03 billion in the period of 2024 to 2029.


4. Industry Impact: Real-World Use Cases

———————————–

4.1. Healthcare

The valuable insights of data warehousing business intelligence can take the dimension of the healthcare sector to a whole other level. Every data-driven decision to optimize healthcare has the potential to save lives. The healthcare professionals identify the high-risk populations & measure health trends. BI dashboards offer healthcare leaders the ability to measure trends in patient preferences.

BI in medical care monitors the care coordination & personalized care delivery. BI drives the revenue cycle management in healthcare by delivering data-driven insights. It empowers the medical professional to streamline the billing process & optimize the revenue. The medical professional leverages BI in their workflow to monitor the operational KPI within their facilities. BI reports help to identify potential risks & optimize the service.


4.2. Retail & E-commerce

The BI tools allow the retail industry to measure sales data, track inventory, and optimize the supply chain. It customizes the marketing campaign and forecasts the demand. BI assists retailers in optimizing the inventory level by measuring the sales patterns & supplier performance. It ensures an adequate stock level while limiting the excessive stock costs.

BI system enables retailers to optimize the merchandising, getting the right products to the ideal store in accurate volume. BI allows retailers to monitor the client segments depending on demographic data. BI tools identify & examine the transaction data, allowing detection of suspicious activity.


4.3. Finance

The financial sector also utilizes a data warehousing services company for detecting anomalies & avoiding fraud. In this fast-moving industry, early detection is necessary. BI tools are necessary for combining the historical & transactional information, and the user profile. It helps to detect any suspicious activities. Real-time dashboards alert analysts about withdrawal activities & wrong login patterns. By incorporating this, businesses can allow faster investigation & limit the false positives.


5. Challenges and Considerations

———————————–

5.1. Data Security & Privacy Risks

Data security is defined as the set of practices to avoid unauthorized access & theft of digital data. It is necessary to track the various layers of software to configure the underlying policies & procedures. This practice is necessary for complying with the rising regulations, like GDPR & HIPAA.

Businesses can manage access to the sensitive insights by utilizing best security practices.  It is recommended to create & implement comprehensive data security plans, utilize encryption for sensitive data, and limit data access. It is necessary to track the data security & perform regular audits.


5.2. Skill Gaps & Training Needs

You need the highest level of data expertise if you want to explore Power BI’s advanced possibilities. When analyzing and controlling the data, you should act quickly. The majority of companies have trouble creating simple reports & accessing complex dashboards. This is a typical gap that may hinder the productivity of your business.

You can use team training sessions or seek the assistance of a qualified Power BI specialist to overcome this obstacle. They can mentor your internal team members and assist you in coming up with sophisticated solutions. Without these initiatives, using Power BI won’t be sufficient to have a significant impact.


5.3. Integration Complexities

Data integration in BI refers to gathering & transforming information from various sources into a unified method. It allows organizations to derive meaningful insights & make informed decisions. Business can drive operational efficiency.

The necessity of data integration is that it has the ability to break down the silos. The integration empowers the organization to make strategic decisions depending on accurate & timely data. An error in integration can cause poor data quality/security & compliance. It can scale the system & integrate diverse data formats & technologies.


Ready to Evolve Your Data Strategy with 2025’s BI Innovations?

The future of BI is exciting yet overwhelming. It is crucial to stay aware of the advancement in BI & growing awareness of data value. Companies that embrace the following tactics will be well-ranked for navigating the challenges of the AI-powered landscape. Power BI empowers the organization to harness the true potential of data. With the intuitive design & powerful analytics, Power BI has become the trending tool for business. Whether you want to make a strategic decision or make sense of data, data warehousing business intelligence is the game-changer!

Read More
Sanju October 15, 2025 0 Comments

Big Data Analytics Software Acceptance: Global Trends and Business Insights

The big data analytics software is a suite of tools that allows organisations to gather, process, and analyse massive and compound datasets to expose hidden patterns and insights.  Such expertise has become dynamic for informed decision-making across all industries, which supports businesses in optimising operations, understanding customer behaviour, and recognising new big data analytics software market opportunities. Big data analytics is being adopted more quickly because of several important trends.

A major driver is digital transformation, which produces huge volumes of data from a growing number of digital sources. The progress of the Internet of Things, with its network of linked devices it makes a constant stream of real-time data that can be analysed to advance efficiency and make smarter products.

Moreover, the incorporation of artificial intelligence and machine learning has made big data analytics more prevailing and automated data analysis, as well as allowing for predictive capabilities. Also, cloud computing delivers the scalable and profitable setup required to store and progression of big data, resulting in it making these progressive analytics available to a broader range of businesses.

The increasing dependence on mobile devices also plays a substantial part; as per Pristine Market Insights, it’s predictable that by 2025, 72.6% of internet users will access the web entirely over smartphones, resulting will further accelerate the size and velocity of data.


Global Adoption Landscape

 —————————–

The global big data analytics landscape is marked by variable levels of acceptance across regions, with North America presently leading due to an established technological infrastructure and a high concentration of main market players and early adopters. Europe is also an important market and country experiencing market expansion due to the growing demand for cloud services and digital transformation. The Asia-Pacific region, though, is predictable to be the fastest-growing market, driven by growing mobile and social media usage and fast digitalisation in countries such as China and India.

The businesses at the forefront of big data analytics acceptance comprise Banking, Financial Services, and Insurance for fraud identification and risk management, as well as healthcare for improving patient outcomes and personalised medicine.

The retail sector influences big data analytics for customer personalisation and demand estimation, whereas industrial uses it for predictive maintenance and supply chain optimisation. Telecommunications and government sectors are major users of big data analytics for managing networks and implementing smart city projects.

Important growing factors of this global acceptance are the vital for scalability to handle ever-increasing data volumes, the demand for real-time insights to allow agile decision-making and gain a competitive edge, and taking efforts on cost optimisation through recognizing and removing operational inefficiencies.


Emerging Trends in Big Data Analytics Software:

 —————————–

Big data analytics is undergoing an important alteration, which is driven by a new wave of innovative technologies and developing business requirements.


Cloud-Based Analytics

There’s a robust change away from on-premises solutions toward cloud-based analytics, leveraging the scalability and flexibility of services such as Software-as-a-Service. The cloud removes the requirement for large, upfront setup investments, making sophisticated big data analytics tools more available to industries of all sizes. Such moves also enable faster deployment and continuous updates.


AI and machine learning Integration

The incorporation of AI and machine learning is an important growth which supports analytics’ transfer from simply describing past data to forecasting and signifying future actions. The AI or machine learning procedures can frequently recognise plans and estimate upcoming outcomes as well as recommend movements, as well as alter raw data into actionable intelligence for tasks such as scam recognition, demand estimation, and personalised customer approvals.


Real-Time Data Processing

Industries are progressively demanding real-time data processing to gain instant insights. It is dangerous for applications where timing is a crucial factor, including monitoring financial transactions for scams and optimising supply chain logistics, as well as personalising customer participation in the moment. The real-time insights allow for more active decision-making.


Data Governance and Security

With the growing volume and understanding of data, there is a rising importance of data governance, compliance, and safety. All organisations are applying outlines to ensure data quality and honesty, as well as privacy.  This is dynamic for obeying guidelines such as the General Data Protection Regulation and the Health Insurance Portability and Accountability Act, and for generating trust with customers by shielding their data from misapplication and breaches.


Expansion of Self-Service Analytics

The availability of data is becoming more accessible through self-service analytics tools. User-friendly tools with instinctive boundaries and drag-and-drop functionalities are allowing non-technical occupational users to perform their investigations, create dashboards, and make reports without depending on IT or data science teams.


Data Visualisation

The practice of sophisticated data visualisation tools is increasing to make complex data more comprehensible and available. By interpreting data into compelling visual stories, governments can advance communication, enable partnership, and drive broader business acceptance of data-driven insights.


Industry-Specific Acceptance Insights:

 —————————–

Big data analytics acceptance is due to the unique requirements in each sector.

Healthcare:

Big data analytics is vital for patient data management and analytical diagnostics, personalising treatment, and estimating disease outbreaks by analysing EHRs, genomic statistics, and wearables.


Financial Services:

This division uses big data analytics for real-time fraud recognition and algorithmic trading. It also allows personalised banking by analysing client behaviour to endorse tailored products.


Retail & eCommerce:

The retailers influence big data analytics for demand estimating to optimise records. By understanding customer behaviour, companies are able to create personalised marketing strategies and flexible pricing plans.


Manufacturing & Supply Chain:

Big data analytics is an important factor in the “smart factory,” allowing projecting maintenance by analysing sensor data to avoid equipment failure. It also optimises the supply chain with real-time visibility.


Telecom & IT:

Businesses use big data analytics for network optimisation to manage traffic and prevent service disturbances. It is also important for customer churn analysis and helping to recognise and retain at-risk customers.


Government & Public Sector:

Big data analytics helps policy planning by analysing large datasets to recognise public requirements. It also supports developing smart cities by optimising services such as traffic management and public safety.


Conclusion:

Big data analytics is no longer a niche technology but a strategic authority. Its acceptance is due to digital alteration and cloud computing, which is reforming businesses worldwide. The upcoming year will see constant growth, with a focus on real-time, AI-powered insights, self-service tools, and strong data governance to reveal the full potential of data-driven decision-making.

Read More
Sanju September 17, 2025 0 Comments

What Are Data Analytics Services? A Complete Beginner’s Guide

Businesses now rely on data-operated insights instead of intuition while making decisions. Clear strategy, skilled operations, and future skills keep businesses ahead of the curve. Data analytics services enable businesses to transform unstructured data. Also, it uses useful intelligence, from predicting market trends to comprehending consumer behaviour. Using data analytics may open new possibilities and improve performance. Regardless of how big or small your company is. You must know about data analytics, types, methods, tools, and importance. Let’s dive in to learn more.


What is Data Analytics?

—————————–

Data analytics is the practice of transforming raw datasets into meaningful patterns. It produces actionable insights that support companies in making well-informed decisions. Thus, data analytics services improve speed and efficiency for intelligent tactics across industries.

There are huge volumes of data created via social media, internet, log files, transactions, and user interactions. But until information is converted into insight, data is useless in and of itself. Data analytics may help firms extract value from the available information. And transform it into strategic business advantages. 


Why is Data Analytics Important?

—————————–

Data analytics services have the power to revolutionize an organization. When businesses use data effectively, they can:

  • Recognize the behavior of your customers
  • Accurately forecast future events
  • Solve data issues clearly
  • Enhance targeting to cut down on useless marketing
  • Reduce wasteful spending and streamline processes.

Types of Data Analytics Services for B2B Businesses

—————————–

Here are the four types of services you must know about.


Descriptive analytics — What happened?

To identify previous trends, descriptive analytics examine historical data. This type of analytics generates summaries using methods like data mining. So, the data is frequently displayed in dashboards and reports. This analysis provides a summary of the events that occurred but does not explain why.


Diagnostic Analytics — Why did it happen?

This kind explores the underlying causes of results in greater detail. Diagnostic analytics look into why a retail company’s sales suddenly decline. Whether it’s because of a competitor’s shift, supply chain interruption, or poor marketing. Regression analysis, filtering, and correlation tracking are some of the methods.


Predictive Analytics — What will happen next?

As the name suggests, predictive analytics make predictions. Mostly about future trends using statistical models, ML, and historical data. It can forecast equipment breakdowns or anticipate sales for the upcoming quarter. It reduces uncertainty in decision-making despite its shortcomings.


Prescriptive Analytics — What should we do about it?

Moving to another analytics type is prescriptive analytics. As it recommends practical tactics based on forecasted results. It uses simulations, optimization models, and algorithms to suggest solutions. This approach facilitates proactive planning for supply chain management, inventory planning, and dynamic pricing.


Top 5 Reasons to Integrate Data Analytics

—————————–

Here are the benefits of data analytics services.

Refining targeting strategies

Businesses know which users will convert into loyal customers. And which marketing channels are most effective, and what content appeals to users. And all this is possible with the help of data analytics services. Enterprises start highly focused marketing campaigns based on data-backed insights. Rather than sweeping campaigns, which increases return on investment.


Continuous innovation

The unfulfilled consumer wants, and market gaps are also found in data pattern analysis. Firms stay ahead of the competition, innovate quickly, and develop new goods with analytics. These revelations are frequently the starting point for ground-breaking concepts for digital transformation.  


Reducing bounce rates

When counting the red flags, high bounce rates stand first. As it indicates that users aren’t getting what they were looking for. So, by looking at the data analytics services, the business can improve its engagement. Also, it affects the conversion rates to ensure what users like. Plus, to make well-informed adjustments to CTAs, content, and site design.


Understanding demographics

Businesses can use analytics to divide their audiences according to some factors. Such as location, interests, age, and gender. A road map for comprehending current markets to enter the new ones is in the demographic data. It enables firms to deliver the correct message to the target audience at the right time.


Streamlining operations

Data analytics services excel to find any discrepancies in the data. Analytics assists businesses in cutting expenses and enhancing performance. Regardless of whether they are dealing with unnecessary procedures. Data-driven decision-making streamlines processes by including speed-up.


Common Techniques in Data Analytics for Businesses

—————————–

Let’s look at some of the commonly used analytics techniques.

Regression analysis

This approach investigates the connections between independent and dependent variables. It aids in forecasting results and comprehending the interdependencies between variables. Such as how pricing adjustments affect sales volume.


Text mining

This method is often referred to as text analytics in data analytics services. It helps to gather information from textual data. Such as social media posts, reviews, and emails. It is employed to identify patterns, moods, and new problems.


Factor analysis

Factor analysis is used for dimension reduction. And makes analysis more manageable and insightful by locating underlying variables. It accounts for the observed variances in huge datasets.


Sensor data analysis

Data from machinery, cars, or Internet of Things devices gets interpreted by sensor analytics. It is necessary to support operational optimization. Even sectors like manufacturing or logistics for predictive maintenance.


Coherent analysis

This approach organizes data according to common traits (e.g., client segments). It facilitates the isolation of patterns within cohorts, enabling more targeted research.


Monte Carlo simulations

By executing multiple scenarios with random variables, it simulates the various outcomes. They are essential for financial forecasting and risk assessment.


Time series analysis

These data analytics services look for trends, seasonality, and cyclical patterns. You can analyze data points across time. It is frequently used for economic forecasting, stock analysis, and sales forecasting.


Popular Data Analytics Tools for Data-Driven Decision-Making

—————————–

Here are some famous data analysis tools that you can use.

  • Microsoft Excel: For small datasets, it is a fundamental tool for data organization, calculation, and visualization.
  • Apache Spark: For large data sets, it is a powerful engine for processing datasets in real-time.
  • SAS: Employed in enterprise-level settings for statistical modeling and advanced analytics.
  • Python: It is the most common language for automation and data visualization.
  • Tableau: One of the top BI platforms for creating dynamic dashboards and data visualization.
  • Power BI: Microsoft’s business analytics tool, ideal for sharing team-to-team information.
  • SQL: Favorite language for management and query of relationship databases.
  • Hadoop: An incredible open-source framework to manage processes and store large data.
  • R programming: This data is excellent for visualization and statistical computation.
  • Splunk: It is used for monitoring and machine-borne data analysis.

Roles and Responsibilities in Data Analytics Consulting

—————————–

Professionals in data analytics services are employed in various fields. Such as HR, e-commerce, healthcare, and finance. Although the roles may be different, specific duties include:

  • Obtaining information from external or internal sources
  • Dataset organization and cleanliness
  • Applying statistical methods for data interpretation
  • Report, dashboard, and visualization
  • Sharing knowledge with interested parties and
  • Providing evidence-based recommendations to support professional strategy.


Conclusion

Data analytics helps to find important insights that induce innovation and aim for progress. It is beyond simple mathematical calculation. The firm taking advantage of the capacity of data analytics will remain competitive. The concept of data analytics is inevitable, whether you want to optimize supply chains or startups to improve user targeting. Your company can fully use data and can change obstacles in opportunities with devices, methods, and plans. Or you can consult data analytics counsulting services for more assistance.

Read More
Sanju June 15, 2025 0 Comments

5 Data Analytics Tools Your Business Can’t Live Without

“Data helps you run the business world, but very often, they are unclear, unstructured, and semi-structured. You need to dig in harder to discover the patterns that matter – but what keeps you easygoing is data analytics tools that push itself to the threshold for in-depth analysis.”

Introduction

Data analytics indeed creates lots of ample opportunities to get into the root level of every problem. But again, it makes a bunch of loopholes, too, that tools only can fill as time is less and demands accuracy to enhance the risk-taking abilities.

In the world of businesses, the application of the tools doesn’t limit to the market’s demand. Still, it extends in broad ranges, from flattering the end-products to understanding the targeted audience and their pain points, serving them in dynamic ways to keep customers happy all time. That’s the prime role for analytics tools – it’s converging to one point – intelligent decision making.

In this blog, you learn the details about data analytics, their importance in businesses, the use of tools in data analytics, tips for choosing the right tools for your business, and five data analytics tools your business can’t live without.

Let’s dive in for more details, and here we go.

Data Analytics: What is it? Why is it So Demanded?

Data analytics means analyzing raw data to reveal its hidden patterns and forming conclusions from that information, then utilizing them to facilitate goals and objectives that every business carries.
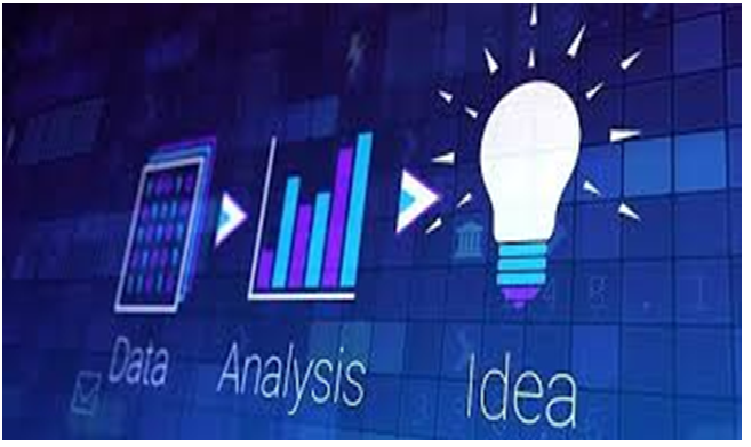
Companies use data analytics to improve their performance, implementing them in the business models to reduce costs and find efficient ways of doing business based on the trending data. With data analytics, taking calculated risks and making the intelligent decision to analyze customers leads to better products and services.

Data analytics itself is a broad topic that incorporates diverse types of data analysis subject to improving things, from revealing trends and metrics to understanding them closely; data analytics has heavy-weighted applications looking into the business world.

Why Do You Need Tools For Data Analytics?

Companies struggle to find the correct data to follow the newest trend in the market, reduce their investments efficiently, and optimize their performance. At the same time, they maximize profits by taking calculated risks.

The analysis is often riskier for two reasons: either data available is irrelevant, or the team is not efficient enough to hit the right target, leading to many blunders. Only 20% of the professionals are efficient in decision making according to Mckinsey and company reports.

It proves a simple thing, i.e., the process is quite laborious and time-consuming. When you do analysis manually, the efficiency is low. Therefore, many techniques and strategies are automated to save time, boost efficiency and add credibility to the data infusing intelligent algorithms powered by AI and machine learning that works on raw data without human interference.


5 Tips For Choosing Your Data Analytics Tools In 2021

It’s 2021, and half of the years have already passed in the eyes. Now don’t say you never use any advanced tools for your business. Or if you started using some of the tools:
Here are a few questions to test your tools’ efficiency:
  • Did you have a hard time choosing the right and efficient tools?
  • And are your tools working efficiently to what you bought them for?
  • Did you explore all the features your tools are having?

If most of your answer is no, then you have not got the right tools for your business. Here are five valid points to help you get the best data analytics tools for your business. And trust me, they will work like wonders.

Research And Discover Why You Need Tools?

Determine the current state of analytical tools implementation, like what features you want in tools and how that will benefit your business. Do in-depth analysis with critical stakeholders, intelligence developers, administrations, and other personnel. That helps your team understand the ins and outs of the problem you have and how tools can help.

Look For The Current State In The Market.

Do your bit of research before picking a particular tool. Look for its updates and new features released recently other than going blindfolded. Many ads are running for tools. If you don’t research, there are maximum chances you may fall into the trap that is placed at a lower price but not practical or revamp versions of outdated tools.

Tools Capability and Classification

Classify the list of tools based on their uses, capability of solving your problems, features, price, popularity. And how often they release the new features. Look for enough tutorials on how to use those tools and blog updates on their website.

By doing this, you will get to know inside out about many tools suitable for your business.

Use Decision Matrix For Better Decision Making

Make sure you know what these tools can do for you, how their interfaces work, and how robust the tools when compared to the price they charge. Data analytics tools are indeed best for creating advanced algorithms but may be lacking additional other features.

Use a decision matrix to clear the air and go for the right ones.

Get Your List Of Tools Ready!

Once you finalized the above four steps, you already got the list of tools you buy next. But this is not the end; everything starts from there. If available, use their trial versions to know most about them and decide your next step. After using the free and premium features, go for the best ones considering your budget. That’s all.


5 Data Analytics Tools Your Business Can’t Live Without in 2021

Microsoft Excel

The two most powerful tools that Microsoft has ever released in the market are Windows OS and Microsoft Office Suite. From drafting in the document to tracking the records on Excel Sheets and sending to prospects from Outlook has become a new routine these days.
 

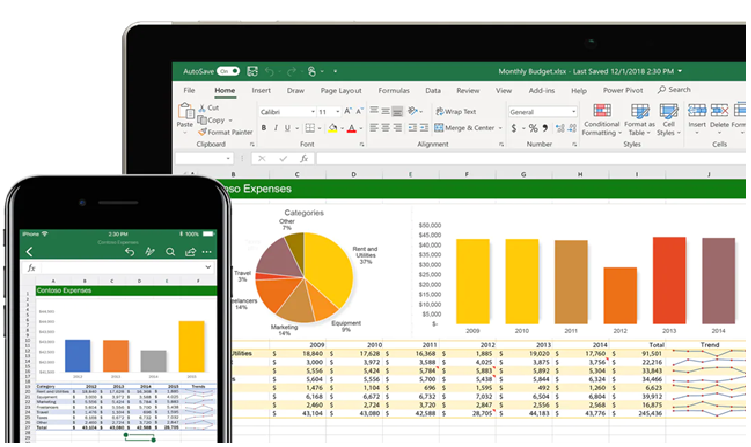
But what makes Excel stand out from the list is some powerful features that make data analysis hassle-free with form creation, pivot table, VBA, etc. Excel has the best statistical features that no one can transcend when it comes to formula-based solving. The platform is robust and straightforward, user-friendly navigation.


And suppose you become thorough with Microsoft Excel. In that case, you can outperform many big players in the market. The results are accurate and come with in-built data visualization techniques that are always the first-choice tool for data analysis.


Tableau for Data Visualization

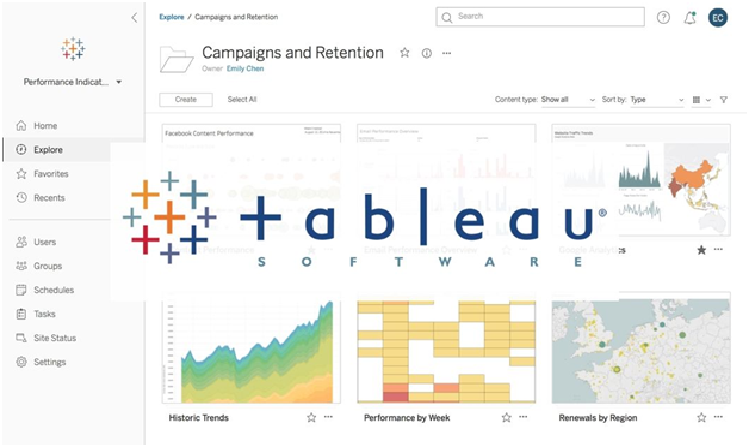
If you have got to pick the only tool for data visualization, then it has to be Tableau undoubtedly, as their motto is quite simple and yet quirky. It says find easy answers to the most challenging questions with one of the leading analytical platforms in the world.
 

Tableau is a visual analytics platform created to transform how people use data to solve a particular problem. The interface is easy to use, has the best community support in the industry united by data. The platform allows you to integrate Salesforce, CRM, and other functionalities to boost your analytics results and build a data culture that holds experts’ trust. It’s a freemium tool that comes with a free trial.


R, Python, and JuPyter Notebook

Though Python is the most popular machine learning language, R languages are not too far behind when compared between duos. Even the cluster analysis and spiline are superior in R compared to Python during the latest analysis as of 2019.
 

Though Python works perfectly on JuPyter, there is something that makes the JuPyter Notebook even more popular. Can you guess that! Although you can run R programming on JuPyter, it can take a long time and waste a lot of time if your concepts are unclear.


If you breakdown the whole process, it will become a series of processes; you have to call:


  • Importing R (base) function
  • Importing R libraries
  • Populating vectors and data frames and formulas that R understands
  • Running models in R and getting the result back on Python
  • Getting model prediction and plotting in R


Xplenty

Xplenty is the next-level tool based on AI and ML advanced algorithms that integrate, process, and prepare data for analytics on the cloud platforms. It comes with a graphical interface to implement ETL, ELT, and counter solutions.
 

This platform helps you create complete data pipelines with less coding or zero coding capabilities with solutions for marketers, developers, sales, and support. They even extend great support through email, phone, chat, and video calls.


It is a flexible and scalable cloud platform that connects multiple data sources with out-of-the-box data transformation components. It has extensions for you to communicate with complex datasets and offers API components for advanced customization to fit your needs.


Qubole

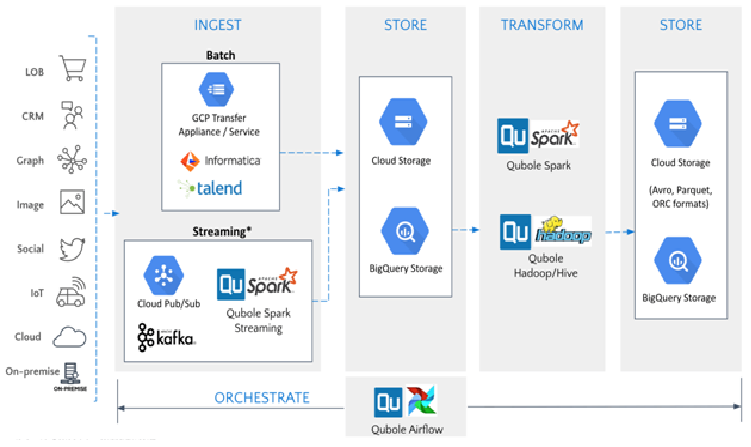
Qubole performs the best for Big data platforms that manage, learn and optimize data independently. The prime objective is to let the employees concentrate on business outcomes instead of executing the Qubole.

The Qubole platform is super-fast, flexible, and scalable. And the prime role is to optimize spending and boost the use of big data analytics. The application platform is transmissible and made up of good navigation dashboards that eliminate poor performance and lock-in facilities and are available globally for all AWS regions worldwide. A few giant corporations that rely on Qubole are Warner music group, Adobe, and Garnett.

Final Words

Without the right choice of tools, data analytics is a long-term game that lacks accuracy and puts the business at higher risk. That’s one of the top reasons enterprises face hindrance and even breakdown in their peak time for simple unnoticed data errors.

Therefore, data analytics is crucial to making any decision-taking calculated risk. This blog tells about five data analytics tools you must use for your business and be ahead in the competition.

Read More
Sanju July 21, 2021 0 Comments